|
| サイトマップ | |
||
|
| サイトマップ | |
||
| トップ | オブジェクト | プロパティ | メソッド | 定数 |
Add メソッド |
オブジェクト:Notebooks, NotebookItems, GraphObjects, NamedDataRanges
Add メソッドは、各種コレクションにおいて新規アイテムを追加するのに使用します。指定する parameters は、コレクションの種類によって変わります:
| コレクション | 値 | パラメーター | 追加される オブジェクト |
|---|---|---|---|
| Notebooks | なし | Notebook | |
| NotebookItems | 1 | CT_WORKSHEET | NativeWorksheetItem |
| 2 | CT_GRAPHICPAGE | GraphItem | |
| 3 | CT_FOLDER | SectionItem | |
| 4 | CT_STATTEST | ReportItem (SigmaStat) | |
| 5 | CT_REPORT | ReportItem (SigmaPlot) | |
| 6 | CT_FIT | FitItem | |
| 7 | CT_NOTEBOOK | NotebookItem | |
| 8 | CT_EXCELWORKSHEET | ExcelItem | |
| 9 | CT_TRANSFORM | TransformItem | |
| 10 | MacroItem | ||
| GraphObjects | 2 | GPT_GRAPH, more... | Graph |
| 3 | GPT_PLOT, more... | Plot | |
| 4 | GPT_AXIS, more... | Axis | |
| 5 | GPT_TEXT, more... | Text | |
| 6 | GPT_LINE, more... | Line | |
| 7 | GPT_SYMBOL, more... | Symbol | |
| 8 | GPT_SOLID, more... | Solid | |
| 9 | GPT_TUPLE, more... | Tuple | |
| 10 | GPT_FUNCTION, more... | Function | |
| 11 | GPT_EXTERNAL, more... | GraphObject | |
| 12 | GPT_BAG, more... | Group | |
| NamedDataRanges | Name (string 型), Left (long 型), Top (long 型), Width (long 型), Height (long 型) | NamedDataRange |
GraphObjects コレクションで GraphObject オブジェクトを新規作成するには、CreateGraphFromTemplate および CreateWizardGraph メソッドを使います。
Notebooks.Add
ActiveDocument.NotebookItems.Add(8)
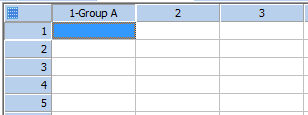
Data 1" の列1に列タイトル "Group A" を追加します。
Dim Group_A As String
Group_A = "Group A"
ActiveDocument.NotebookItems("Data 1").DataTable.NamedRanges.Add(Group_A,0,0,1,-1)
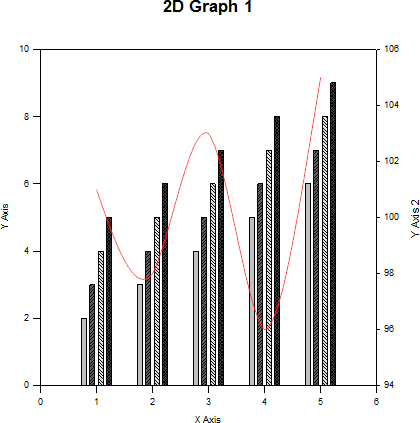
Dim ANotebook As Object
Set ANotebook = Notebooks.Add
Dim DataItem As Object
Set DataItem = ANotebook.NotebookItems("Data 1")
Dim ADataTable As Object
Set ADataTable = DataItem.DataTable

'Create some example data.
Dim i
For i = 1 To 5
ADataTable.Cell(0,i-1) = i
ADataTable.Cell(1,i-1) = i+1
ADataTable.Cell(2,i-1) = i+2
ADataTable.Cell(3,i-1) = i+3
ADataTable.Cell(4,i-1) = i+4
Next i
Dim Sign
Sign = 1
For i = 1 To 5
ADataTable.Cell(5,i - 1) = 100 + i*Sign
Sign = -Sign
Next i

'Create graphics page in the notebook
Dim GraphicPage
Set GraphicPage = ANotebook.NotebookItems.Add(CT_GRAPHICPAGE)

'Create a graph manually. (This isn't recommended. Better to use CreateWizardGraph)
Dim PageObject As Object
Set PageObject = GraphicPage.GraphPages(0)

Dim AGraphObject As Object
Set AGraphObject = PageObject.ChildObjects.Add(GPT_GRAPH, SGA_COORD_CART2, SLA_TYPE_BAR, SLA_SUBTYPE_VERTY)

MsgBox("Count of plots in graph: " + CStr(AGraphObject.Plots.Count),0+64,"Plot Count")

Dim PlotObject As Object
Set PlotObject = AGraphObject.Plots(0)

'Plot objects only allow you to add objects of type GPT_TUPLE
'Add 4 tuples to make a grouped bar chart with groups of 4.
PlotObject.ChildObjects.Add(GPT_TUPLE, 0,1)
PlotObject.ChildObjects.Add(GPT_TUPLE, 0,2)
PlotObject.ChildObjects.Add(GPT_TUPLE, 0,3)
PlotObject.ChildObjects.Add(GPT_TUPLE, 0,4)

MsgBox("Count of tuples in plot: " + CStr(PlotObject.ChildObjects.Count),0+64,"Tuple Count")

' Get some repeat type schemes for the two tuples.
Dim FillScheme
FillScheme = PlotObject.StockScheme(STOCKSCHEME_PATTERN_OLDINCREMENT)
' Tell the plot to use the "old increment" scheme"
PlotObject.Fill.SetAttribute(SDA_PATTERNREPEAT, FillScheme)
' Set the initial density and pattern
PlotObject.Fill.SetAttribute(SDA_PATTERN, (SDA_DENS_FINE*&H10000) + SDA_PAT_HOLLOW)

'Get some repeat type schemes for the two tuples.
Dim ColorScheme
ColorScheme = PlotObject.StockScheme(STOCKSCHEME_COLOR_GRAYS)

'Tell the plot to use the "gray" scheme"
PlotObject.Fill.SetAttribute(SDA_COLORREPEAT, ColorScheme)
' Set the initial color in the pattern
PlotObject.Fill.SetAttribute(SDA_COLOR, RGB_GRAY)

'Add a line plot to the graph.
Set PlotObject = AGraphObject.Plots.Add(GPT_PLOT, SLA_TYPE_SCATTER, SLA_SUBTYPE_NORMAL)
'Plot objects only allow you to add objects of type GPT_TUPLE
PlotObject.ChildObjects.Add(GPT_TUPLE, 0,5)

'Turn on the line for the scatter plot
PlotObject.SetAttribute(SLA_PLOTOPTIONS, FlagOn(SLA_FLAG_LINEON))
'Make it a spline.
PlotObject.SetAttribute(SLA_LINEPATH, SLA_PATH_SPLINE)

'Set the main plot line's attributes. Make sure it is selected
'by deselecting all drop lines and function lines.
PlotObject.SetAttribute(SLA_SELECTFUNC,SLA_FUNC_NONE)
PlotObject.SetAttribute(SLA_SELECTDROP,DIM_NONE)
'Set the main line color
PlotObject.SetAttribute(SEA_COLOR,RGB_RED)
'Make sure the graph and plot are current
AGraphObject.SetObjectCurrent
PlotObject.SetObjectCurrent
'Add a new Y axis
GraphicPage.AddWizardAxis(SAA_TYPE_LINEAR,DIM_Y,AxisPosRightNormal)
'Create a normal line
Dim Points()
Redim Points(3)
Points(0) = -3520
Points(1) = 2479
Points(2) = -2187
Points(3) = 3188
Dim LineObject As Object
Set LineObject = ActiveDocument.CurrentPageItem.GraphPages(0).ChildObjects.Add(GPT_LINE, Points)
LineObject.SetAttribute(SEA_END2TYPE, 1) ' normal line end
'Create an arrow
Redim Points(3)
Points(0) = -687
Points(1) = 3167
Points(2) = 21
Points(3) = 1896
Set LineObject = ActiveDocument.CurrentPageItem.GraphPages(0).ChildObjects.Add(GPT_LINE, Points)
LineObject.SetAttribute(SEA_END2TYPE, 2) ' arrow line end

'Create a box
Redim Points(3)
Points(0) = -3041
Points(1) = 896
Points(2) = -375
Points(3) = -250
ActiveDocument.CurrentPageItem.GraphPages(0).ChildObjects.Add(GPT_SOLID, Points, SOA_EXT_RECT)

'Create an ellipse
Redim Points(3)
Points(0) = 0
Points(1) = 833
Points(2) = 2146
Points(3) = -333
ActiveDocument.CurrentPageItem.GraphPages(0).ChildObjects.Add(GPT_SOLID, Points, SOA_EXT_ELLIPSE)

'Select all objects
ActiveDocument.CurrentPageItem.Select(False, -4854, 3625, 2937, -2812)

'Make them red.
ActiveDocument.CurrentPageItem.SetSelectedObjectsAttribute(SOA_COLOR, &H000000ff)
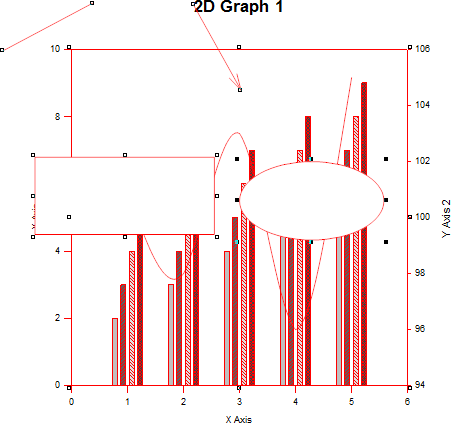
Dim Points()
Redim Points(1)
Points(0) = 2041
Points(1) = 1958
ActiveDocument.CurrentPageItem.GraphPages(0).ChildObjects.Add(GPT_TEXT, "", Points)
ActiveDocument.CurrentPageItem.SetCurrentObjectAttribute(GPM_SETOBJECTATTR, STA_ORIENTATION, 0)
ActiveDocument.CurrentPageItem.SetCurrentObjectAttribute(GPM_SETOBJECTATTR, STA_RTF , _
"{\rtf1\ansi0{\colortbl\red0\green0\blue0;}\deff0{\fonttbl\f0\fnil Arial;}\ql\sl200\slmult0\f0\cf0\up0\fs20\i0\b0\ul0Outlier}")
ActiveDocument.CurrentPageItem.SetCurrentObjectAttribute(GPM_SETOBJECTATTR, STA_OPTIONS, &H00008001)
ActiveDocument.CurrentPageItem.SetCurrentObjectAttribute(GPM_SETOBJECTATTR, STA_PARAGRAPHJUSTIFY, STA_JUSTIFY_LEFT)