|
| サイトマップ | |
||
|
| サイトマップ | |
||
| トップ | オブジェクト | プロパティ | メソッド | 定数 |
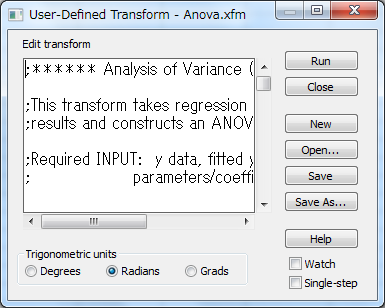
RunEditor メソッド |
オブジェクト:TransformItem
指定した TransformItem オブジェクトについて、ユーザー定義トランスフォームエディターを呼び出します。
Dim SPTransform As Object
Set SPTransform = ActiveDocument.NotebookItems.Add(9)
SPTransform.Name = path + "\Transforms\Anova.xfm"
SPTransform.Open
SPTransform.RunEditor
;****** Analysis of Variance (ANOVA) Table ******

;This transform takes regression or curve fit
;results and constructs an ANOVA table

;Required INPUT:  y data, fitted y data, function
;                 parameters/coefficients

;RESULTS: sum of squares, degrees of freedom, mean
;         squared, F-value, R-squared & R values,
;         standard error of fit

;INPUT to be placed in (specify source columns):
y_col=2           ;y data column number
fit_col=3         ;fitted y data column number
param_col=4       ;parameter column number

;ANOVA to be placed in column:
anova=5           ;ANOVA table starting column
;(5 columns x 10 rows)

y=col(y_col)      ;define y values
f=col(fit_col)    ;define fitted y values
p=col(param_col)  ;define function parameters
n=count(y)        ;number of y datapoints
tdof=n-1          ;total degrees of freedom

r=count(if(p<>0,p,"--"))  ;the number of nonzero
;parameters

;******* ANOVA TABLE CALCULATION *******

;Regression Degrees of Freedom:
rdof=tdof-if(r<2,"n < 2 !",f1)

;R squared:
R2=(1-SSE/SSM)

;****** PLACE ANOVA TABLE IN WORKSHEET *******

col(anova)={0/0,"REGRESSION","ERROR","TOTAL"}
col(anova+1)={"SUM OF SQUARES",SSR,SSE,SSM}
col(anova+2)={"DEG FREEDOM",edof,rdof,tdof}
col(anova+3)={"MEAN SQUARE",(SSR/edof),(SSE/rdof)}
col(anova+4)={"F",F}
col(anova,7)={"#POINTS","R SQUARED","R","STD ERR"}
col(anova+1,7)={n,R2,sqrt(R2),se}