|
| サイトマップ | |
||
|
| サイトマップ | |
||

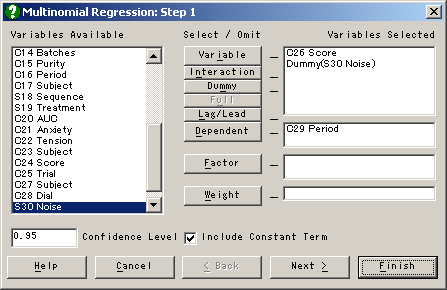
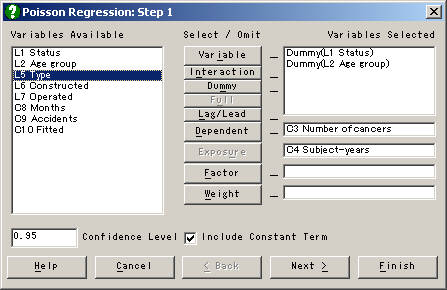
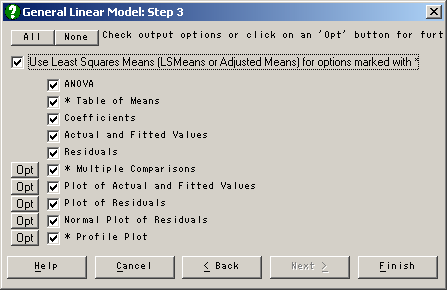
UNISTAT Version 5.6 では、以下の機能が追加されました。
| Least Squares Means |
Standard Error |
t-Statistic | Significance | Lower 95% | Upper 95% | |
|---|---|---|---|---|---|---|
| Constant | 107.7414 | 1.043 | 103.3001 | 0 | 105.6485 | 109.8344 |
| Region = 1 | 106.1586 | 1.809 | 58.6825 | 0 | 102.5285 | 109.7887 |
| 2 | 109.2338 | 1.6841 | 64.8611 | 0 | 105.8544 | 112.6132 |
| 3 | 107.832 | 1.9188 | 56.1985 | 0 | 103.9817 | 111.6823 |
| Type = 1 | 107.5782 | 1.7373 | 61.9241 | 0 | 104.0922 | 111.0643 |
| 2 | 107.9047 | 1.1547 | 93.45 | 0 | 105.5877 | 110.2217 |
| Region x Type = 1 x 1 |
103.6271 | 2.5584 | 40.5053 | 0 | 98.4934 | 108.7609 |
| 1 x 2 | 108.69 | 2.5584 | 42.4843 | 0 | 103.5563 | 113.8237 |
| 2 x 1 | 111.52 | 3.0271 | 36.8406 | 0 | 105.4457 | 117.5943 |
| 2 x 2 | 106.9476 | 1.4771 | 72.4053 | 0 | 103.9837 | 109.9116 |
| 3 x 1 | 107.5875 | 3.3844 | 31.7893 | 0 | 100.7962 | 114.3788 |
| 3 x 2 | 108.0764 | 1.809 | 59.7426 | 0 | 104.4463 | 111.7065 |
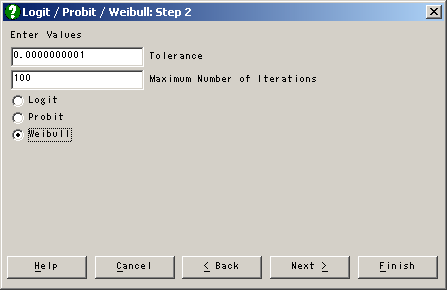
** Regression Results **

Model selected: Weibull
Valid Number of Cases: 16, 0 Omitted
Response Variable: Good
Subject Variable: Total

|                                                      1-Tail
|    Coefficient Standard Error    Z-Statistic    Probability
-------------------+------------------------------------------------------------
Constant|        -1.5228         0.0821       -18.5421         0.0000
A|         0.5113         0.0937         5.4590         0.0002
B|         0.2301         0.0880         2.6139         0.0241
C|         0.7574         0.0886         8.5528         0.0000
D|         0.2878         0.1286         2.2388         0.0468

|      Lower 95%      Upper 95%
-------------------+------------------------------
Constant|        -1.6838        -1.3619
A|         0.3277         0.6949
B|         0.0576         0.4027
C|         0.5839         0.9310
D|         0.0358         0.5398

-2 Log likelihood = 2106.3834
Goodness of Fit:
Chi-Square Statistic = 15.9936
Degrees of Freedom = 11
Right-Tail Probability = 0.1414