|
| サイトマップ | |
||
|
| サイトマップ | |
||
| トップ | オブジェクト | プロパティ | メソッド | 定数 |
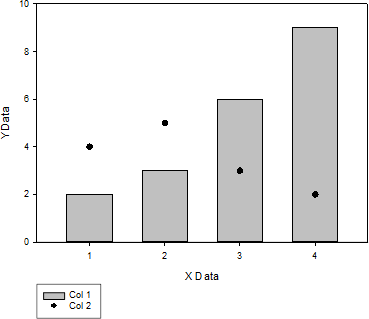
AddWizardPlot メソッド |
オブジェクト:GraphItem
指定した GraphItem オブジェクトの現在のグラフに、プロットを定義する以下のパラメーターを使用して新規プロットを追加します。
| パラメーター | 値 | 指定 |
|---|---|---|
| グラフタイプ | 規定のタイプ名 | 必須 |
| グラフスタイル | 規定のスタイル名 | 必須 |
| データフォーマット | 規定のデータフォーマット名 | 必須 |
| 列配列 | 列の番号/タイトルからなる配列 | 必須 |
| 1プロット配列あたりの列数 | 1プロット配列あたりの列数 | 省略可能 |
| エラーバーのソース | 規定のソース名 | エラーバープロットのみ |
| 上方向エラーバーの計算法 | 規定の計算法の名称 | エラーバープロットのみ |
| 角度軸 (angular axis) の単位 | 規定の角度軸の単位名 | 極座標プロットのみ |
| 軸範囲の最小値 | 規定の角度の値 | 極座標プロットのみ |
| 軸範囲の最大値 | 規定の角度の値 | 極座標プロットのみ |
| 三角軸の単位 | 三角軸スケールの上限値 | 三角プロットのみ |
| 下方向エラーバーの計算法 | 規定の計算法の名称 | エラーバープロットのみ |
| 行の選択 | ブール値:True の場合は、y 反復 (行サマリー) プロットの行範囲を選択可能。事前に y 反復データを配置するマクロをサポートする場合は False を選択。 | Row サマリー プロットのみ |
Dim GraphPage As Object
Set GraphPage = ActiveDocument.NotebookItems.Add(CT_GRAPHICPAGE)
Dim ColumnList(0)
ColumnList(0) = 0
GraphPage.CreateWizardGraph("Vertical Bar Chart", "Simple Bar", "Single Y", ColumnList)
ColumnList(0) = 1
GraphPage.AddWizardPlot("Scatter Plot", "Simple Scatter", "Single Y", ColumnList)
| タイプ | スタイル |
|---|---|
| Scatter Plot |
|
| Line Plot |
|
| Line and Scatter Plot |
|
| Polar Plot |
|
| Vertical Bar Chart |
|
| Horizontal Bar Chart |
|
| Box Plot |
|
| Pie Chart | |
| Contour Plot | |
| 3D Scatter Plot | |
| 3D Line Plot | |
| 3D Mesh Plot | |
| 3D Bar Chart | |
| Ternary Plot |
|
| Bubble Plot |
| タイプ | データフォーマット名 |
|---|---|
| Simples (one curve) plots |
|
| Multiple curve and column plots |
|
| Polar plots |
|
| 3D and contour |
|
| Ternary |
|
| Pie |
|
| パラメーター | ソース名 |
|---|---|
| エラーバーのソース |
|
| パラメーター | 計算法の名称 |
|---|---|
| Upper (Error Bar Computation Parameter) |
|
| Lower (Error Bar Computation Parameter) |
|
| パラメーター | 角度軸の単位名 |
|---|---|
| 角度軸 |
|
| パラメーター | 三角軸スケールの上限値 |
|---|---|
| 三角軸の単位 |
|