
Software for the Design and Manufacture of Optical Thin Film Coatings
The industry’s leading software for designing and manufacturing optical thin film coatings that won’t require you to take a class or hire an expert to use. It’s simple, it’s easy, and with our product TFCalc, you can design coatings for lenses, computer monitors, eyeglasses, window panes, light bulbs, hot and cold mirrors, x-rays mirrors.
Why TFCalc?
- Easy to use
- A stable, reliable tool that runs on Windows
- Equipped with features required by coating designers
- Equipped with features not found in other design programs
- Unlimited definition of materials, substrates, and illuminants
- Setting variable indices for layers, and combining multiple materials on a single layer
- Provides a cost-effective solution
- Powerful optimization features:
- Needle optimization
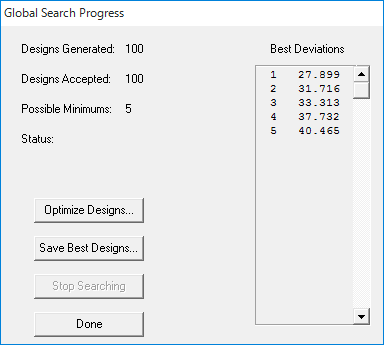
- Global search
- Sensitivity optimization
- Cone-angle targets optimization
Case Study: Empowering Optics Students with TFCalc for Coating Design

Alexis Vogt, PhD
Endowed Chair & Professor of Optics
Monroe Community College (NY, USA)
More information about TFCalc
- Can maintain the symmetry of a design while it’s being optimized.
- Helps the designer locate the designs that minimize the merit function.
- Utilizes needle optimization, a powerful tool in designing multilayer coatings.
- Allows for needle/tunneling, so the designer has more designs from which to choose when it comes to manufacturing.
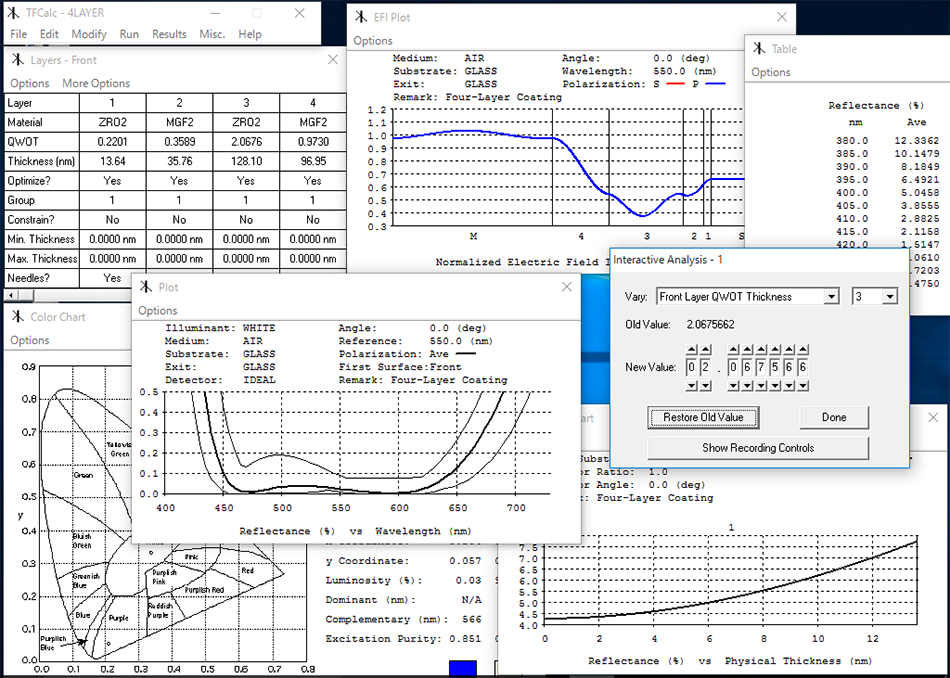
- Computes EFI (electrical field intensity) to calculate performance of thin film coatings.
- Utilizes Monte Carlo method to generate random designs…and then displays results!
- Can compute the sensitivity of each coating layer of a design.
- Can simulate the output of an optical monitor, used in the manufacturing thin film coatings.
- Determines the refractive index of a thin layer coating using variable materials and fitting a dispersion formula.
- All computations are done with 10-byte extended-precision numbers, which offer about four additional digits. This is important for designs having many layers.
TFCalc is a powerful program with many features. This summary is not a complete list of its capabilities. For a more complete description of TFCalc, the user manual should be read. Another way to learn about TFCalc is to run the demo version, which is available for downloading from this website.
Thin Films
- Up to 5000 layers on both sides of the substrate
- Layers can be added manually or created with a stack formula, such as (HL)^5 1.2(HL)^5

- Layers may have a variable index
- Layers may consist of mixtures of two materials
- Layer thickness may be entered as physical or quarter-wave optical thickness
- Layer thicknesses may be constrained
- Thicknesses may be adjusted for angle
- A layer may be replaced by an equivalent (HLH)^p or (LHL)^p stack
- Layers may be grouped to preserve symmetry or to shift a sequence of layers
- Rugate coatings can be simulated
- Layers may consist of active and gain materials
Analysis
- Compute reflectance, transmittance, absorptance, optical density, loss, phase shift, psi, group delay (GD), group delay dispersion (GDD), TOD, and electric field intensity
- Compute reflected or transmitted color (CIE and LAB)
- Compute equivalent (Herpin) index of a sequence of layers
- Compute the sensitivity of reflectance, transmittance, absorptance, optical density, loss, phase shift, and color to normal manufacturing errors (thickness and index)
- Compute the layer sensitivity
- Compute cone-angle average (also called biconical) reflectance, transmittance, absorptance, density, and loss with user-defined radiation distributions
- Interactive analysis can be used to determine how changes to one or more parameters affect the performance
- Animations can be created using the interactive analysis feature
- Yield analysis allows the user to determine the manufacturability of a coating
- Either the Muller or Abeles phase shift convention may be selected
- Simulate the output of a light monitor
- Compute admittance
Optimization
- Three local methods: Variable Metric, Gradient, and Simplex
- Global Search may be used to find the best coating design
- Needle optimization (with tunneling) may be used to synthesize unusual designs
- Vary either thickness or index or both
- Layer thickness can be constrained during optimization
- Deviations are displayed during optimization
- Index profile may be displayed during optimization
- Flexible merit function
- Optimize front and back layers simultaneously
- Optimize group factors
- Sensitivity may be optimized
- Zero-thickness layers may be removed automatically during optimization
- An illuminant and a detector function may be entered, making it possible to optimize a coating for specific environments
- The product R*T can be optimized
- Performance from both sides of a coating can be optimized
- Cone-angle average may be optimized
- Ultra-fast quantities (GD, GDD, TOD) may be optimized
- Automatic design of bandpass filters using the prototype method
Optimization Targets
- Optimization targets can be reflectance, transmittance, absorptance, density, color, luminance, phase shift, group delay, group delay dispersion, TOD, and psi at any wavelength, polarization, and angle
- Targets can be either discrete (one wavelength), continuous (for a range of wavelengths), or cone-average (for a cone of angles)
- First, second, and third derivatives of these quantities maybe used as targets
- Targets can be entered manually, generated automatically, or read from files
- Generated targets may be distributed by wavelength, wave number, or logarithmically
- Target values can be inequalities
- Up to 5000 targets
- Targets for multiple environments
- Equal-ripple targets can be generated
- Target values can be entered in dB
Results
- Results may be displayed numerically or graphically
- All tables and graphs can be printed
- Results can be saved in a file for processing by other programs
- Results can be saved as an animation
- Results of up to 5 coating designs can be displayed simultaneously on a graph
- Two results, such as reflectance and transmittance, can be overlaid on one graph
- Screen plots have a cursor that enables the designer to read numbers from the plot
- Performance statistics may be computed for any result
- Save plots as GIF files
Optical Data
- Unlimited number of material, substrate, illuminant, detector, and radiation distribution data files
- Refractive index maybe entered as tables or dispersion formulas
- Internal transmittance can be read for substrates
- Missing N or K data can be filled in using interpolation
- Refractive index (N and K) can be computed from spectral or ellipsometric data
- Material and substrate data can be absorbing and dispersive
- The reflectance or transmittance of a coating can be saved as an illuminant
- Comments can be stored with each data file
- Data can be read from text files
- Blackbody illuminants may be created
Coating Files
- Contain all information about a coating — layers, targets, comments, variable materials, etc.
- Easy to copy parts of one coating file to another
- Export coating designs to Code V and ZEMAX optical design software
Accurate and Fast
- All calculations are done in 16-digit floating-point arithmetic
- During optimization, TFCalc calculates up to 500,000 layers/second on top-of-the-line computers
User Interface
- Easy-to-use, standard Windows user interface
- Menus, dialogs, spreadsheet-like windows
- Very easy to edit and recompute
History of TFCalc enhancements
Latest version: TFCalc 3.6.2
- TFCalc 3.4 Changes
- TFCalc 3.3 Changes
- TFCalc 3.2 Changes
- TFCalc 3.1 Changes
- TFCalc 3.0 Changes
- TFCalc 2.9 Changes
- TFCalc 2.8 Changes
TFCalc System Requirements
- OS: Windows 10, 11 (32-bit mode)
※ TFCalc is designed to allow for a single user or a single machine. Please contact us, if you want to use TFCalc in a thinclient environment.
Single user license
- It can be installed on 2 machines for only the case of using a TFCalc by the same user, not available for simultaneous use.
- When multiple users want to use TFCalc, each user must purchase a separate TFCalc license.
Single machine license
- When TFCalc is installed on only one machine, any users who can access it can use TFCalc on it.
- When you want to install multiple machines, each machine must be installed with a separate TFCalc license.